Pre-reqs: Know what ELK is, posses a running pfSense instance and ELK cluster :)
As I test out new tools, host new services and start to experiment with malware samples it has become increasingly apparent that I need better visibility to ensure my network stays secure. To fit this need I originally deployed a single node Security Onion instance, this was super easy to deploy and pipe my pfSense logs to. However, with such ease, I missed out on a lot of the learning potential. Not to mention, when I wanted to start customizing my deployment I was lost since Security Onion tailored Elasticsearch to their product. So I took a step back, nuked my security onion instance, and deployed an ELK stack instead to learn the “right way”.
And so far so good! As expected and evident of this article, I’m learning a lot about ELK and feel confident enough to hopefully help others with their ELK stack integrations.
Though it isn’t the best thing to disclose, I use a pfSense firewall for my lab. My first goal since creating my ELK cluster was to get my firewall logs piped into Elastic to be able to create dashboards and better monitor my environment. So with the pre-reqs listed above satisfied and the reasoning behind this project laid out, lets get started!
Overview:
- Create Ubuntu server VM to run elastic agent acting as a “Forward Node”.
- Create Fleet policy, add pfSense integration.
- Deploy agent to forward node
- Pipe pfSense logs to forward node through pfSense settings
- Create a lifecycle policy for log handling
Create Ubuntu VM
Though “Forwarding Node” does not appear to be an official term, it is what I am calling this VM, since that is the role it serves and that is what Security Onion calls it’s nodes that serve the same purpose. This node will collect the logs from pfSense and use the integration to parse and filter the logs before forwarding the data into Elastic.
Follow this tutorial to create your initial VM. Feel free to customize as you like, you really just need SSH access and network access to your firewall and access to your Elastic over 9200/TCP from this vm.
Using a static IP will be best since you want to ensure logs are always delivered to this VM from pfSense.
Once you have this setup and updated. SSH to this VM and pull up your Elastic cluster in a browser window.
Create Fleet Policy & Deploy Agent
You could create a standalone agent instead for this, but it is a lot cleaner to use Fleet to deploy agents to provide better management and application of lifecycle policies.
- Sign into Elastic
- Navigate to Management>Fleet>Agent Policies
- “Create Agent Policy”, Enter and name and leave defaults, “Create”
- From the “Agent Policies” overview, click on the one you just created.
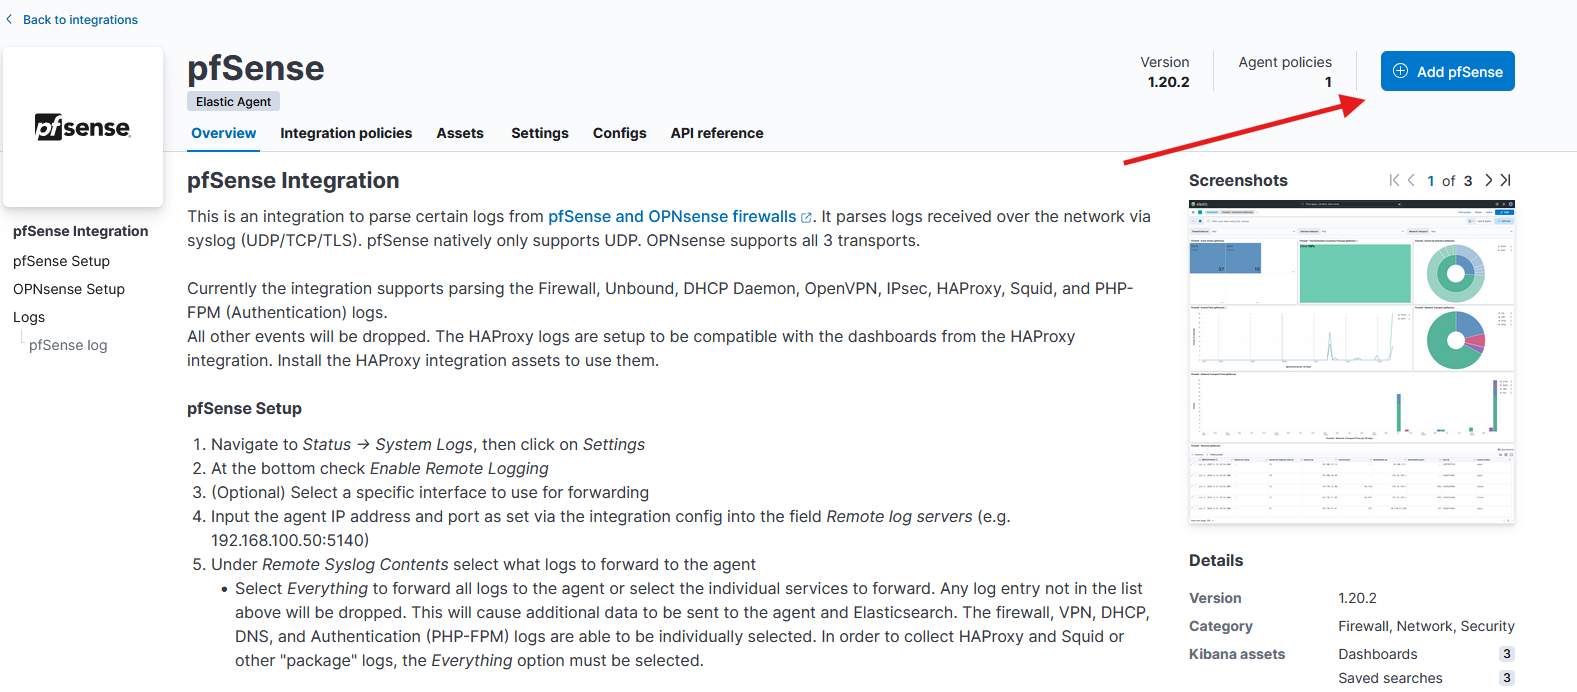
- “Add Integration”, search for “pfSense”, click on the tile.
- Click “+ Add pfSense”

You’ll configure the integration on the page that pops up. You need to ensure you change “localhost” to “0.0.0.0”. This ensures the integration will work on all interfaces. All other defaults are fine.
- “Save and Continue”
- “Add Elastic Agent to hosts”
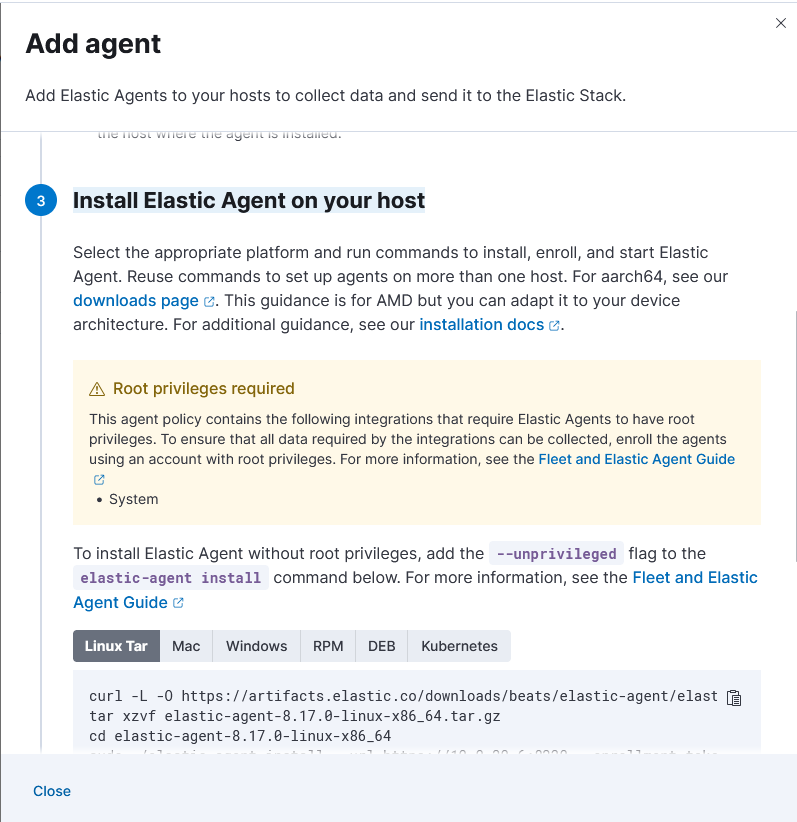
- Scroll down until you get to “Install Elastic Agent on your host”

Please note that if you are using self signed certificates, you’ll need to transfer over and update your cert repo before continuing to ensure you do not encounter any issues. Here is an easy way to do that, assuming you have your cert on 1.2.3.4 in the root (“/”, not “/root”) directory
scp elk@1.2.3.4:/ca.crt /usr/local/share/ca-certificates/
sudo update-ca-certificates
See the commands under “Linux Tar” in the above screenshot? You’ll need to run these on your Ubuntu Server VM.
Example:
curl -L -O https://artifacts.elastic.co/downloads/beats/elastic-agent/elastic-agent-8.17.0-linux-x86_64.tar.gz
tar xzvf elastic-agent-8.17.0-linux-x86_64.tar.gz
cd elastic-agent-8.17.0-linux-x86_64
sudo ./elastic-agent install --url=https://10.0.20.6:8220 --enrollment-token={enrollmentTokenHere}=
Send logs to agent from pfSense
Now you are ready to send logs to your agent. Navigate to the following location in pfSense:

- Ensure “syslog” is set for log message format.
- Click the checkbox for “Enable Remote Logging”
- In remote log servers set enter the following “IP_UBUNTU_VM:9001”
- Ensure “everything” is selected for “Remote Syslog Contents”
Lifecycle Policy
Now you should have logs flowing into Elastic! You can head over to your dashboards and look for the pre-built pfSense dashboard “Firewall - Dashboard [pfSense]” to verify.
Lets create a policy to handle the backing indicies handing your pfSense logs data stream. Please note, I am still developing my own policy, I will provide an update here in the future with my exact configuration.
- Head to “Management”>“Index Lifecycle Policies”.
- Create a policy based on your organizational requirements.
Now to utilize it
- Select it from the list under “Index Lifecycle Policies”
- “Manage”>“Add to index template”
- “Index Template”, Search for “logs-pfsense.log” (This is the default template created)
- “Add Policy”
Conclusion
If you have any comments, please contact me on LinkedIn to discuss. I am always trying to improve!